It’s easy to add analytics and end up with dashboards full of numbers that never change a decision: page views, total sign-ups, time on site. These are vanity metrics. They go up and to the right and tell you nothing about what to build next.
We wanted one setup across all our apps that answers a few questions well. Where do people come from? Do they get to the point where the app is useful? Do they come back? And which app deserves the next few weeks of work?
Cloud, not self-hosted
Our first plan was to self-host PostHog on the server that already runs our apps. Reading the current installer changed our minds: the real stack is Kafka, ClickHouse, Postgres, Redis and a dozen services, and it asks for at least 8 GB of memory. That’s a second server to run and patch, just for analytics.
PostHog Cloud gives the same analysis with nothing to operate, and its free tier is far more than a handful of small apps need. We’d revisit self-hosting only if volume or cost ever made it worthwhile, and then on its own server.
Each app gets its own PostHog project, so events never mix and every app has its own dashboards. Server and uptime monitoring stays in a separate tool. “Is it up?” and “Is it useful?” are different questions.
A deliberately thin event list
Beyond what PostHog captures automatically (page views, clicks, and where a visitor came from), each app sends only two events:
user_signed_up, once, when an account is created.activated, when a user first gets real value: in Braineos, finishing a study session. Each app defines its own version of this moment, and it’s the most important line of analytics code we write.
Two details make these useful rather than decorative:
- Identify on sign-in. Linking the anonymous visitor to their account carries the first-visit data, such as the referring site and campaign, through to the sign-up. That turns two disconnected counts into a funnel.
- Send the key events from the server. Ad blockers and closed tabs drop browser events. A sign-up recorded by the server that created the account doesn’t get lost.
The questions it answers
With just that, PostHog can show:
- Sign-ups by source. Which posts, listings and campaigns bring people who actually sign up, not just visits.
- The sign-up to activation funnel. How many new users reach the useful moment, and where the rest drop off. Low activation is an onboarding problem, and more traffic won’t fix it.
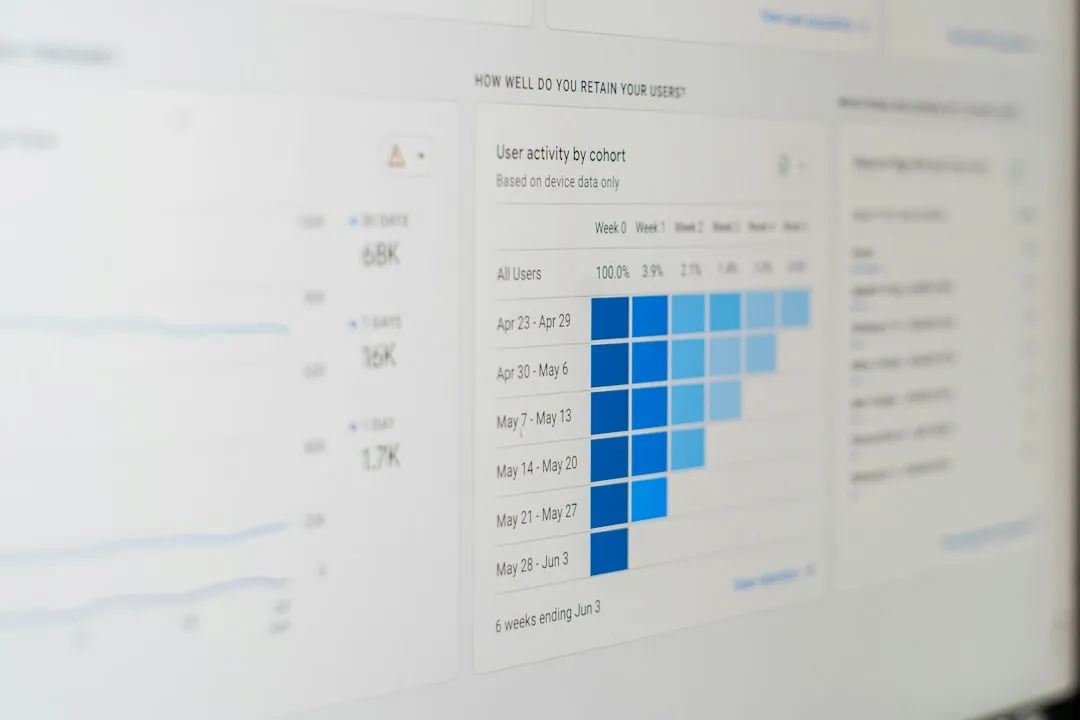
- Retention by cohort. Whether activated users come back next week. This is the honest test of whether something is worth building on.
- A portfolio view. The same three numbers side by side for each app, to answer “where should the next block of time go?”
What we deliberately left out
No event for every button, no custom schema registry, no second analytics tool. Payments aren’t tracked here yet either, because they come from the billing system, which is the source of truth for revenue.
A short event list is one people can trust. When a number moves, everyone knows what it means.